STEM lessons : Popcorn and probability
High school STEM teachers test out interdisciplinary lessons

Quick, illustrate the statistical concepts of binomial, Gaussian and lognormal distribution using a Galton Board.
No? OK, then, just make some popcorn.
That?s all it takes, as 45 teachers from 11 Delaware high schools learned during a professional development program at the University of Delaware?s Interdisciplinary Science and Engineering Laboratory (ISE Lab) in January.
Actually, making the popcorn was only the first step in a series of laboratory experiences designed for the teachers to try out and then take back to their own classrooms to illustrate various concepts in science, technology, engineering and mathematics (STEM).
Thursday morning?s laboratory session went on to include gathering and analyzing data from the process of popping corn and extending the results to such topics as physics, probability, evolutionary biology and genetics.
The teachers will return to UD in June, with selected students from their schools, to demonstrate ways in which they refined or adapted the laboratory lessons during the second half of the school year. In the process, they will share those lab activities and lesson plans with their colleagues for use in other Delaware classrooms as well.
?But this week, the teachers are the students,? said Jon Manon, who is associate director for mathematics in UD?s Professional Development Center for Educators and co-director for the state Department of Education?s Mathematics and Science Partnership (MSP) grant that supports the STEM professional development program.
The grant?s other co-director is John Jungck, professor and director of the DuPont Science Learning Laboratories, the instructional wing of ISE Lab.

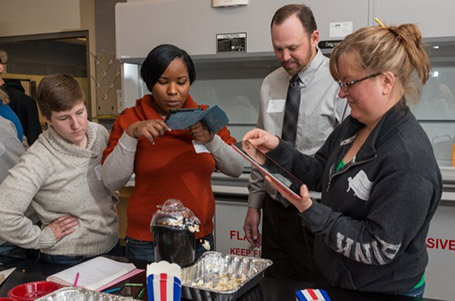
The first activity in the lab Thursday required teachers to air-pop a selection of different kinds of popcorn and count the rate at which the kernels popped. With the help of audio and visual recordings of the process and a specialized app, the teams of teachers divided the popping process into 10-second intervals and counted the number of kernels that popped during each segment.
As it turns out, they pop at a rate ? a small number at the beginning, many more in the middle, and a small number toward the end ? that can be graphed as what is commonly called a bell curve.
?That?s why, when you wait for those last, slow kernels to pop, the ones that popped early can end up burned,? Jungck said.
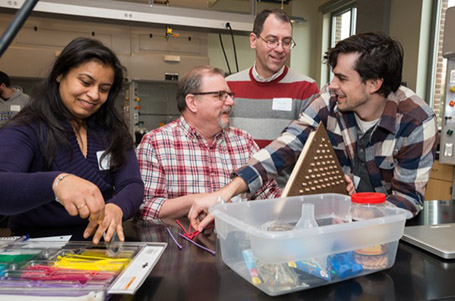
The teachers also built Galton Boards, which are a 3-D way of showing ? by rolling small balls randomly into an array of channels on the board ? the same kind of distribution, known as normal or Gaussian, that looks similar to a bell curve.
Teachers, who worked in interdisciplinary teams from each school, said the lesson was especially useful because of its connections to many subjects beyond statistics and probability. A key goal of the MSP project is to find ways in which teachers from different science and math disciplines can work together to show STEM connections to their students.
?The nice thing about what we?re doing today is that it?s based in statistics, and that?s useful for analyzing data in so many fields,? said Peter Yonko, who teaches physics at Newark High School. ?So this kind of lesson is very applicable across disciplines.?
For Appoquinimink High School teacher Samantha Neubert, the experience at ISE Lab had her already thinking of ways to expand the lesson into other topics for students in her Advanced Placement environmental science class.
?I can see using this to discuss corn as an agricultural product, biodiversity, how a particular variety might have characteristics like heat sensitivity that would determine where it would be grown ?,? she said. ?And I think this is also a really good way to teach statistics and probability lessons. It?s much more engaging for the students.?
February 9, 2015
